
We expected ChatGPT to flood PyPI. Coding agents did.
Antonio Pascarella
PyPI crossed 1,000,000 packages in July 2026. The last 100,000 of them took four months. The first 100,000 took twelve years.
PyPI crossed 1,000,000 packages in July 2026. The last 100,000 of them took four months. The first 100,000 took twelve years.
Every new package on PyPI starts with someone deciding a piece of Python is worth publishing. That makes the birth rate of packages a fairly direct measure of how much new Python is being written and shipped. So when AI coding tools arrived, there was an obvious thing to test. If AI makes writing code cheaper, the number of new packages should bend upward after the tools land.
We tested it on the full 21-year history of PyPI: 23,470,188 uploaded distribution files, 1,003,715 distinct package names. Dex pulled the data out of BigQuery. Viz drew the charts. The chatbot era left no mark on the curve. The agent era changed its shape twice, and the size of the change tracks how widely coding agents were actually being used.
If you are here for the tools, this is a full walkthrough you can copy onto your own data. If you are here for the result, skip to The findings. For the causal argument and its limits, go to Why we think coding agents are the cause.
The tools
Dex is a warehouse agent. It lists what you have, profiles it, and runs SQL behind a guard. The part that matters on a public dataset you do not own: it is read-only, it only allows SELECT, and it estimates every statement before running it so you confirm the cost first. On this project that guard did real work. See How we got the data.
Viz is a dashboard agent. You give it a CSV, describe the chart in plain
words, and it builds the chart. No chart config and no plotting code. The two
prompts that produced everything below are in viz.md, exactly as we
typed them.
The data
Source: bigquery-public-data.pypi,
Google's public mirror of PyPI. Three tables:
| table | rows | used? |
|---|---|---|
distribution_metadata | 23,470,188 | yes, one row per uploaded file |
file_downloads | petabyte scale | no |
simple_requests | petabyte scale | no |
We only needed two columns of one table: name and upload_time.
The metric. A package is born in month M if the earliest upload of that package name anywhere in the table falls in M.
new_packages[M]        = count of names whose first-ever upload is in M
cumulative_packages[M] = running total of new_packages up to and including M
That gives a birth rate (new names per month) and a total (names ever seen). The
output is a tidy CSV with 514 rows: date, metric, value. The partial month of
August 2026 is dropped, so the series ends at the last complete month, July 2026.
How we got the data
Step 0. Config, free. A connector file pointing at the dataset, billing
project exmergo-viz, and location: US, because the public dataset lives in
the US multi-region and jobs sent anywhere else simply fail. Budget ceiling set
to 1 TB.
Step 1. Inventory, free. explore inventory --rank returned the three tables
and confirmed the real name and type of the upload timestamp column, so the query
did not have to guess.
Step 2. The guard earning its keep. The obvious next command is
explore map, which profiles every table in the dataset. Here that would have
touched file_downloads and simple_requests: roughly 2.5 PB, or about $16,000.
Dex estimated it, refused, and showed us the number. Read-only credentials cannot
exclude those two tables from a dataset-wide map, so we scoped the schema cache
to the two columns we actually query and ran the real aggregation through the
query guard instead.
That is the case for a cost guard in one command. The naive move on this dataset is a five-figure mistake, and nothing in the dataset's name warns you.
Step 3. The query, billed and tiny. Estimate first, 545 MB, confirm, run:
WITH firsts AS (
  SELECT name, MIN(upload_time) AS first_upload
  FROM `bigquery-public-data.pypi.distribution_metadata`
  GROUP BY name
),
monthly AS (
  SELECT DATE_TRUNC(DATE(first_upload), MONTH) AS month, COUNT(*) AS new_packages
  FROM firsts GROUP BY month
)
SELECT month, new_packages,
       SUM(new_packages) OVER (ORDER BY month) AS cumulative_packages
FROM monthly ORDER BY month;
Billed: 545 MB, about $0.003. The whole session, including the inventory, came
to 705 MB. That is under one cent. The ledger is in
.dex/spend.jsonl and every statement we ran is in
.dex/queries.jsonl.
Step 4. Handoff. CSV into Viz, two prompts, two charts.
The findings
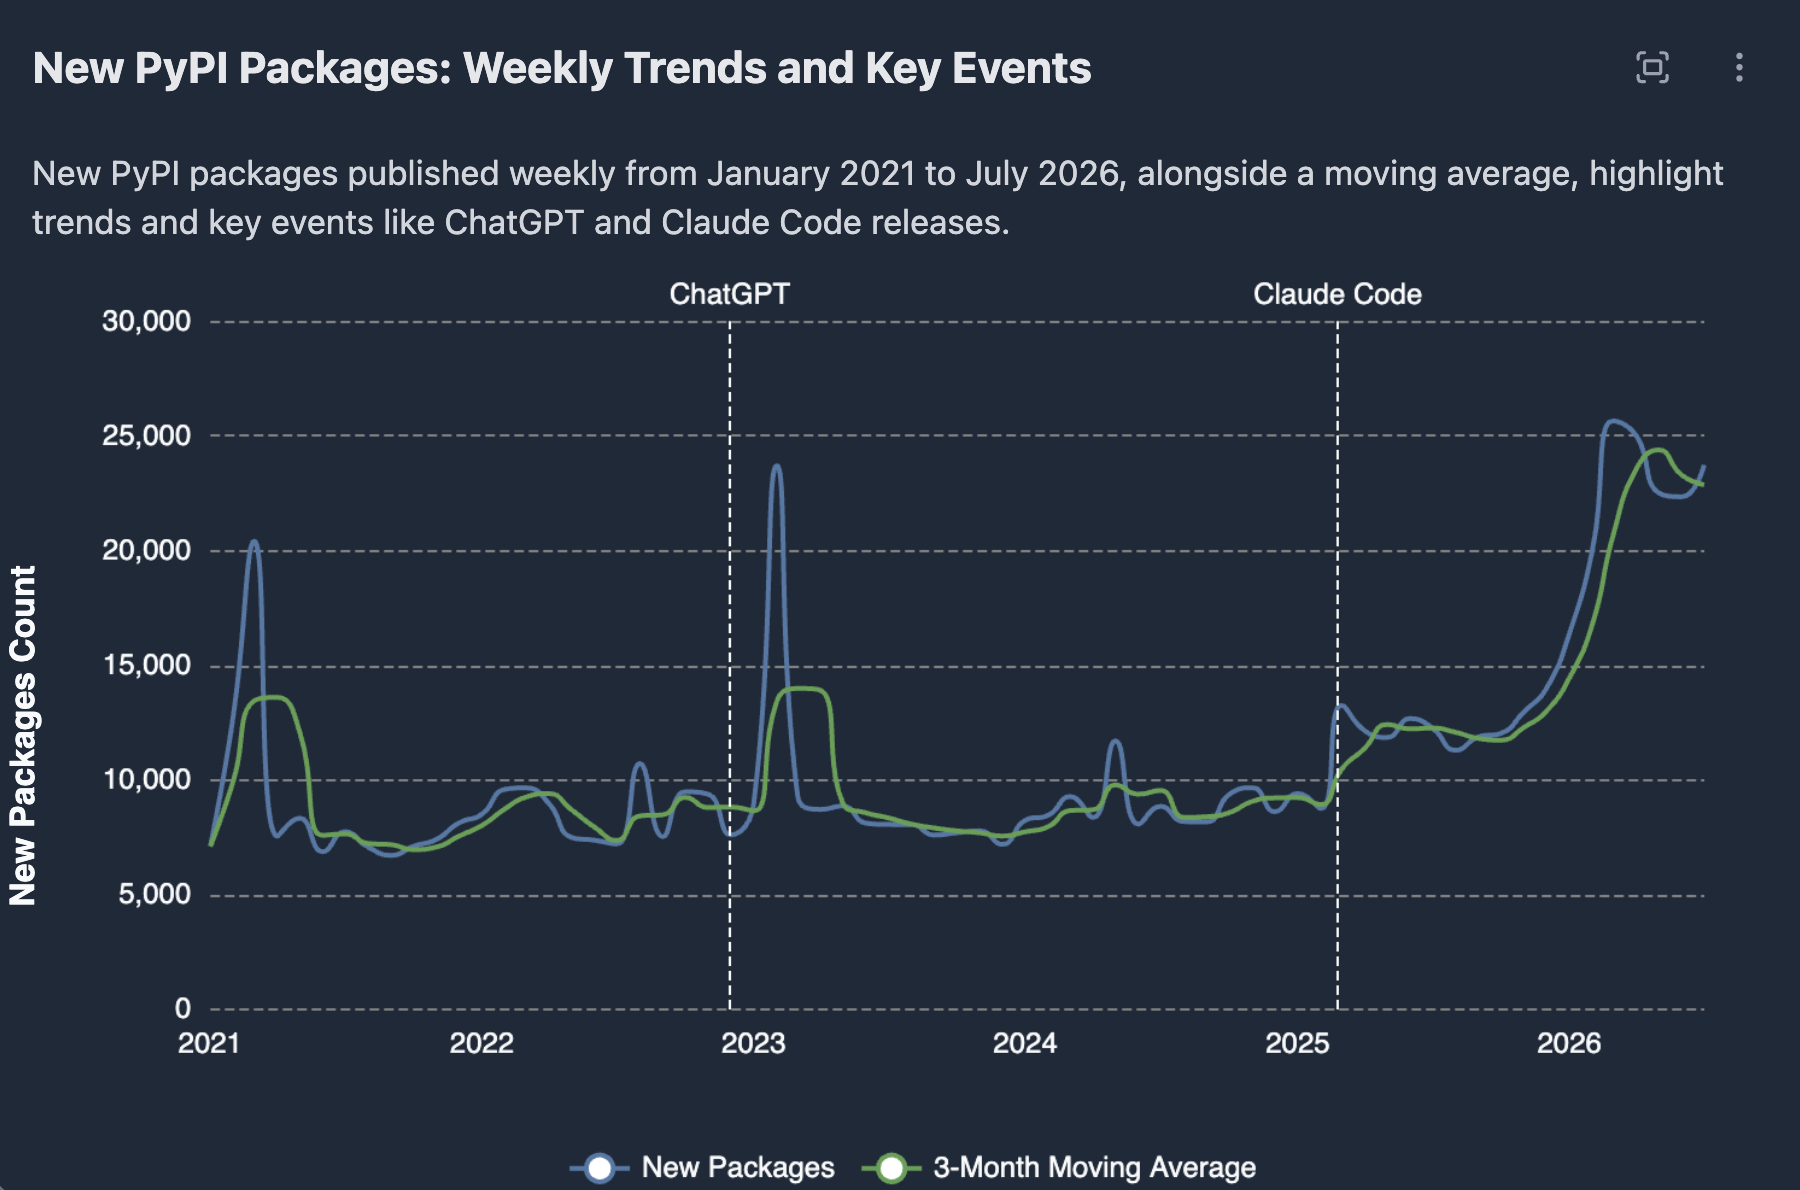
The whole test in one chart. The blue line is how many brand new package names showed up each month. The green dashed line is the three month average, there to keep the spikes from doing the talking. The two yellow lines are ChatGPT and Claude Code. Look at the left half, then the right quarter. From 2021 to 2024 the line mostly sits between 7,000 and 10,000 a month. It rises out of that band five times, in February and March 2021, August 2022, February 2023 and May 2024, and each time it falls straight back where it came from. After early 2025 the line steps up and stays up, and through 2026 it climbs past 25,000. That last stretch is the only part of the chart that goes up and never comes back.
1. ChatGPT's launch is invisible
ChatGPT went public on 30 November 2022. If cheap code generation drives package creation, the twelve months after should look different from the twelve months before. They do not. On the chart, the first dashed line has no step next to it. The green average walks straight through the event and comes out the other side at the same height.
| window | avg new packages per month | vs before |
|---|---|---|
| 12 months before ChatGPT (Dec 2021 to Nov 2022) | 8,668 | |
| 12 months after (Dec 2022 to Nov 2023) | 9,536 | +10% |
| same window, without the Feb 2023 spike | 8,248 | -5% |
The one thing you do see after ChatGPT is the tall spike just past the line. That is February 2023, which added 23,704 new packages on its own, roughly triple the months around it, and it lines up with a known PyPI spam and malware flood rather than with people writing more Python. It is also the whole of the apparent 10% rise. Take that single month out and the year after ChatGPT is slightly below the year before it.
Note the shape of that spike, because it matters later. It goes up for one month and comes back down. The early 2021 spike does the same thing.
Then nothing happens for two more years. 2021 averaged 8,940 new packages a month. 2022: 8,624. 2023: 9,502. 2024: 8,914. Four flat years, straight through the loudest period of AI hype software has seen.
2. The change starts in March 2025
Now look at the second dashed line. February 2025 is an ordinary month, 8,753 new packages, in line with the previous four years. March 2025 is 13,253, and the level holds there for the rest of the year. This is the first place in five and a half years where the green average leaves its band and does not come back.
| window | avg new packages per month | vs before |
|---|---|---|
| 12 months before Claude Code (Mar 2024 to Feb 2025) | 9,035 | |
| 12 months after (Mar 2025 to Feb 2026) | 13,398 | +48% |
| months 13 to 17 (Mar to Jul 2026) | 23,845 | +164% |
That is what separates this from February 2023. A spam flood is a spike. This is a step. It holds for ten straight months in 2025 and then goes higher instead of falling back.
Claude Code's research preview shipped four weeks before the step, which is why we drew the line there. It is not a claim that one product caused it. GitHub announced Copilot agent mode on 6 February 2025 and Claude Code arrived on 24 February, so two agent tools reached developers in the same three weeks, and the step follows both. See Why we think coding agents are the cause.
3. Then 2026 doubles it
The steepest part of the chart is the last one, and there is no marker on it. From December 2025 the line climbs from about 14,000 to more than 25,000 by March 2026, then holds around 23,000 through July.
In those first seven months of 2026, PyPI gained 155,673 new packages. That is more than the whole of 2025, which added 142,498. The average month in 2026 is 22,239 new packages: 1.9 times the 2025 average and 2.5 times 2024. Put another way, 28% of every package name that has ever existed on PyPI was created after March 2025.
This second step is the part that needs an explanation beyond "a tool shipped." Nothing launched in January 2026. What did change is scale: by February 2026 the agent tools had gone from early-adopter software to something a large share of working developers used every day. The next section lines the two curves up.
4. Four flat years, then 2026
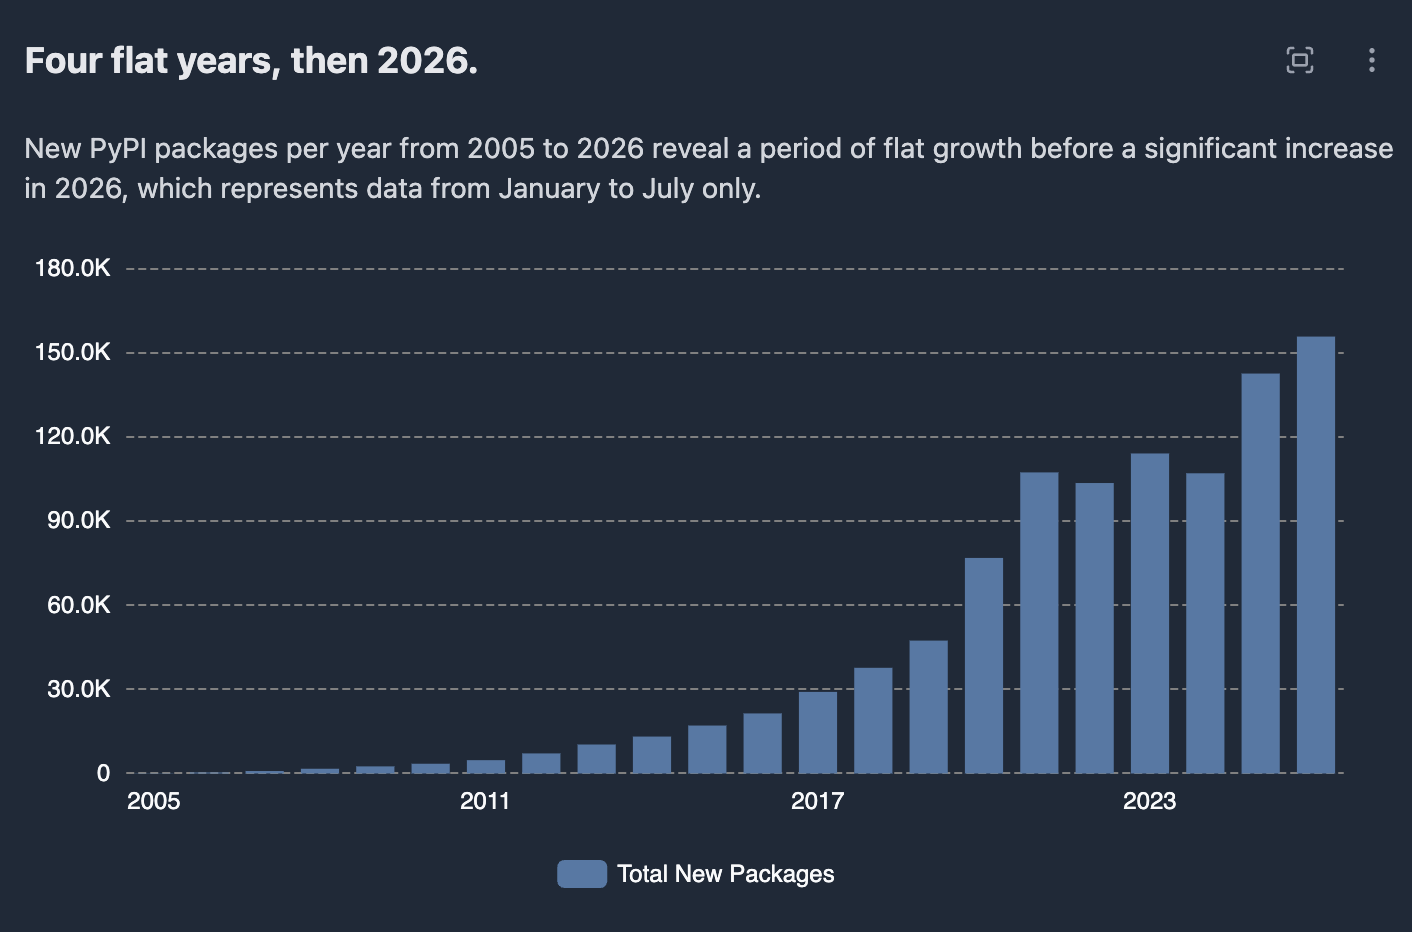
Same data, zoomed all the way out: every new package per calendar year since 2005. The first fifteen bars are so short you can barely see them, which is the point. Then look at 2021 to 2024, four bars at almost exactly the same height. The last bar is 2026, and it only covers seven months. It is still the tallest one on the chart.
| year | new packages | year | new packages | |
|---|---|---|---|---|
| 2019 | 47,351 | 2023 | 114,028 | |
| 2020 | 76,802 | 2024 | 106,963 | |
| 2021 | 107,277 | 2025 | 142,498 | |
| 2022 | 103,490 | 2026 (Jan to Jul) | 155,673 |
Four years, 2021 through 2024, sit within about 10% of each other at around 108,000 packages a year. The ChatGPT period is that flat stretch. Then 2025 breaks it by a third, and 2026 passes all of 2025 in seven months.
The cumulative side of the series tells the same story. Counting the months PyPI needed to add each successive 100,000 packages:
| block | reached | months to add |
|---|---|---|
| 0 to 100k | Jul 2017 | 148 |
| 100k to 200k | Jan 2020 | 30 |
| 200k to 300k | Mar 2021 | 14 |
| 300k to 400k | Mar 2022 | 12 |
| 400k to 500k | Feb 2023 | 11 |
| 500k to 600k | Jan 2024 | 11 |
| 600k to 700k | Dec 2024 | 11 |
| 700k to 800k | Sep 2025 | 9 |
| 800k to 900k | Mar 2026 | 6 |
| 900k to 1M | Jul 2026 | 4 |
PyPI held a steady 11 months per 100,000 packages across three blocks covering 2022 to 2024, the ChatGPT years, then broke that rhythm three times in a row: 9, 6, 4. The first 100,000 packages took 148 months. The most recent 100,000 took four.
The live dashboards
Both charts are live in Viz, so you can hover the points and read the exact values yourself:
The static images above are just screenshots of these.
Why we think coding agents are the cause
"Something changed in 2025 and again in 2026" is not a finding. It is a gap in one. So we put the PyPI curve next to the only other curve that moves the same way in the same months: how widely coding agents were actually being used.
The two curves line up, twice
PyPI numbers are ours, from the series in this repo. Agent adoption numbers come from vendor announcements, press coverage and third-party trackers, listed under Sources. Treat the adoption levels as approximate. The timing and the shape are the parts that carry the argument.
| quarter | new PyPI packages per month | what was happening in coding agents |
|---|---|---|
| 2024 Q1 to Q4 | 8,661, 9,379, 8,399, 9,216 | agents exist, but behind waitlists, previews and niche tools. Nothing agentic ships inside the editors most developers use |
| 2025 Q1 | 10,472 | Copilot agent mode announced 6 Feb 2025. Claude Code research preview 24 Feb 2025 |
| 2025 Q2 | 12,224 | Copilot agent mode reaches all VS Code stable users (Apr). Copilot coding agent public preview (19 May). Cursor passes $500M ARR (Jun) |
| 2025 Q3 | 11,808 | Copilot coding agent generally available to paid subscribers (Sep). Claude Code run-rate passes $500M |
| 2025 Q4 | 12,996 | Cursor reaches $1B ARR and Claude Code reaches a $1B run-rate (Nov) |
| 2026 Q1 | 20,699 | Claude Code run-rate $2.5B, weekly active users double inside the quarter, and it is credited with about 4% of all public GitHub commits (Feb). Cursor passes $2B ARR (Mar). Claude Code and Cursor are now the primary tool for 28% and 24% of developers who use one |
| 2026 Q2 | 23,283 | Cursor near $4B ARR (May). Surveys put AI-tool use at 84% of developers and AI-written code near 41% of new code |
| 2026 Q3 (Jul) | 23,728 | our series ends here, at the last complete month |
Read the two columns together and the shape is the same in both. Flat through 2024, a step in the first half of 2025 as agent modes ship, a plateau while adoption is still early-adopter, then a sharp climb through 2026 as those tools become daily software for a large share of developers. The PyPI birth rate did not double because a product launched in January 2026. It doubled while agent usage itself was doubling.
That is what makes this different from the ChatGPT test. ChatGPT reached hundreds of millions of people and moved this curve by nothing, because a chatbot in a browser tab does not publish a package. An agent with a shell does.
The mechanism is direct, and it has been observed
A chatbot produces text a human then retypes. An agent runs commands. The
distance between "write me a package" and a live PyPI name is one uv publish or
one release workflow, and the agent can run it.
This is not hypothetical. In one documented 2026 incident, an AI agent wrote a malicious Python package, published it to the real PyPI registry, and it was downloaded and executed on 15 real systems within about an hour. Whatever else that incident says, it establishes that agents publish to PyPI directly.
There is also a content signal. An independent analysis of PyPI publishing rates in May 2026 noted that a large share of newly published packages are LLM-related: agent frameworks, agent loops and similar infrastructure. New packages are not just more numerous, they are disproportionately about agents.
Independent corroboration, different metric
We measure first-ever uploads of a package name. That same independent analysis measures a different thing, packages published per week including new releases of existing packages, using a different method. It reports roughly a 30% increase since 2025 and attributes it to AI. Two different metrics, two different people, same direction and same period. That is worth more than either alone.
Why this is our leading explanation, not one option in a list
- Timing, twice. Both steps in our series follow agent milestones within weeks. Nothing follows ChatGPT.
- Dose response. The first step is +48% and arrives with early-adopter tools. The second is +164% and arrives with mass adoption. A bigger dose of agents matches a bigger move in packages.
- Shape. Both steps are sustained and stepped. Every previous distortion in this series, including February 2023, was a single spike that fell straight back.
- A mechanism that has actually been seen publishing to PyPI.
- A second, independent measurement pointing the same way.
What would prove it, and what would kill it
We are still reading two aggregate curves, and two curves moving together is not proof. These are the tests we would run next, all of them on the same dataset with a bigger cost confirmation:
- Publisher accounts. If agents drive this, the rise should concentrate in new accounts and in accounts publishing many names in a short window. If it is spread evenly across long-standing publishers, our explanation weakens.
- Survival. Share of new packages that ever reach a second release. Agent scaffolding should look disposable, with a lower survival rate than the 2021 to 2024 baseline.
- Usage. Downloads per new package, from
file_downloads. If the extra packages have no users at all, we are measuring noise production, not software production. - Build fingerprints. The
pyproject.tomland build-tool metadata carried in each distribution. Agent scaffolds leave recognisable patterns and default layouts. - Content. How many new names are agent infrastructure, by keyword and dependency, which would test the LLM-related observation above at scale.
- Cross-registry check. The same first-upload measurement on npm and crates.io. Agents are language-agnostic, so an agent-driven effect should show up in more than one registry. A PyPI-only effect points to something local to PyPI instead.
Alternatives we weighed, and why they rank lower
- Publishing got mechanically easier. Real, but the dates do not fit.
uvshipped in February 2024 and trusted publishing landed earlier still, both inside the flat stretch, and neither produced a step. Easier publishing also predicts gradual drift, not two sharp steps. - A long-running spam or typosquat campaign. Live, and not ruled out. It is the strongest competitor to our explanation. What argues against it: PyPI's known floods are single-month spikes that revert, while this holds for seventeen months and steps up twice. Note also that agent-generated junk is not an alternative to our explanation. Hallucinated package names produced by models, and the slopsquatting that follows them, are an agent effect too.
- Machine accounts and repo splitting. One company publishing 40 internal packages looks like 40 developers. This inflates the level at any point in time, but it does not explain a change of shape in 2025 and 2026 unless the practice itself grew in exactly those quarters.
- General growth of Python. Python did keep growing, but the four flat years from 2021 to 2024 are the same years Python was already growing fast. A secular trend does not sit flat for four years and then double.
Nothing in this dataset alone separates these, because the dataset has no idea what a real package is. That is what the tests above are for.
Caveats we publish with the numbers
- This is a correlation argument, not a controlled one. We name coding agents as the leading cause because the timing, the size and the shape all match, a mechanism exists and has been observed, and a second independent measurement agrees. That is still two aggregate curves moving together. No row in this dataset says who or what created a package, so nothing here attributes a single package to an agent. The tests listed under What would prove it are how this stops being a correlation.
- Adoption figures are secondary sources. Revenue run-rates, user counts and survey percentages come from vendor announcements, press coverage and third-party trackers, and they disagree with each other at the margins. We use them for timing and rough scale only. None of our own numbers depend on them.
- This counts unique package names. Not quality, not usage, not survival. Deleted and yanked packages may or may not still be in the source table.
- Spam inflates the counts. Certainly the February 2023 spike, probably some part of the recent rise.
- Pre-2010 timestamps are approximate. Early PyPI history was partly backfilled, so the first few years of the birth rate are indicative only. No conclusion here depends on them. All of them rest on 2021 onward.
- 2026 is partial. The series ends at July 2026, the last complete month. Every 2026 figure quoted is either a monthly average or clearly labelled as seven months.
Reproduce it
git clone https://github.com/AntoPascarella/pypi-open-research.git
cd pypi-open-research

# Dex, with your own billing project in .dex/config.yml
dex connect test
dex explore inventory --rank              # free
dex explore query --sql-file query.sql    # estimate, confirm, about 545 MB

# then paste the prompts from viz.md into Viz, one per chart
# both charts read packages_over_time.csv directly, nothing to pre-process
Do not run dex explore map on this dataset before reading Step 2 above. Dex
will stop you. The point is that nothing else will.
Repo layout
| path | what |
|---|---|
README.md | this piece |
packages_over_time.csv | the series: date, metric, value, 514 rows, Mar 2005 to Jul 2026 |
query.sql | the one billed query |
viz.md | the two Viz prompts, as typed |
DATA.md | dataset methodology and caveats |
.dex/ | connector config, schema cache, query ledger, spend ledger |
charts/ | the chart exports used above |
Sources
Our own numbers all come from
packages_over_time.csv, produced by
query.sql against bigquery-public-data.pypi. Everything below is
external, and is used for the timing and rough scale of agent adoption.
Agent product milestones, primary sources:
- GitHub, Copilot agent mode announcement, 6 Feb 2025
- GitHub, agent mode rolling out to all VS Code users
- GitHub changelog, Copilot coding agent public preview, 19 May 2025
- GitHub, coding agent for Copilot press release
Adoption and revenue, secondary sources and trackers:
- Sacra, Cursor revenue and funding
- Contrary Research, Cursor business breakdown
- Claude Code statistics tracker
- Claude Code adoption and revenue summary
- AI coding adoption, 50 data points from 7 surveys
PyPI-side evidence and mechanism:
- Artem Golubin, PyPI packages are increasing rapidly, updated 17 May 2026 (independent measurement of packages published per week, about +30% since 2025, attributed to AI, with the note that many new packages are LLM-related)
- StepSecurity, an AI agent published a malicious package to PyPI and 15 systems ran it
- Phoenix Security, AI-enabled supply chain attacks on npm and PyPI in 2026 (hallucinated package names and slopsquatting)
Open research from Exmergo. Data pulled with Dex, charted with Viz. Total warehouse spend for this piece: under one cent.