
For Marketing Teams
From Campaign Data to Metrics Your Team Can Trust
Your data team uses Dex to model the campaign, spend, conversion, and revenue data already in your warehouse, and to define what each metric means. Marketing uses Viz to visualize performance and share reports, without waiting on the reporting queue.
Dex
Explore, transform, maintain
Your data team, in the warehouse and the dbt project
Semantic layer
Models, metrics, join paths
One governed set of definitions your team owns
Viz
Dashboards and reports
Business users, answering their own questions
Marketing Reporting Is Broken
Campaign metrics live in one system, revenue in another, and customer data in a third. Even once all of it has landed in the warehouse, nobody agrees on what a conversion is, which spend column is net of fees, or how a campaign joins to a closed deal.
So every reporting cycle turns into a negotiation: exports, spreadsheet wrangling, and two dashboards that disagree by enough to make the whole thing arguable.
Exmergo settles the question upstream. Data teams use Dex to model the marketing data already in the warehouse and to write down what each metric means. Marketing then visualizes those definitions in Viz, so the number in a board deck is the number in the dashboard.
Define it once, report on it everywhere
Step 1 · Data team
Build the foundation with Dex
Your data team points Dex at the campaign, spend, conversion, and revenue tables already landing in the warehouse. Dex profiles them, authors the dbt models that join them, and defines metrics such as spend, conversions, and attributed revenue as semantic definitions the team reviews and owns.
Step 2 · Business users
Visualize it with Viz
Marketing opens Viz and asks for channel performance, spend against pipeline, or a month-over-month view. Viz resolves each metric against those definitions and builds the dashboard, ready to publish and share with leadership.
Marketing Intelligence, Not Marketing Guesswork
Campaign Performance Dashboards
Visualize spend, conversions, and channel performance in Viz, built on the metric definitions your data team maintains rather than a formula typed into a BI tool.
One Definition of Attributed Revenue
Dex writes the join between campaign execution and revenue into the semantic layer, so every report reads the same attribution logic instead of each analyst rebuilding it.
Exec-Ready Reporting
Publish a Viz dashboard leadership can explore on its own, with each chart traceable back to the definition behind it.
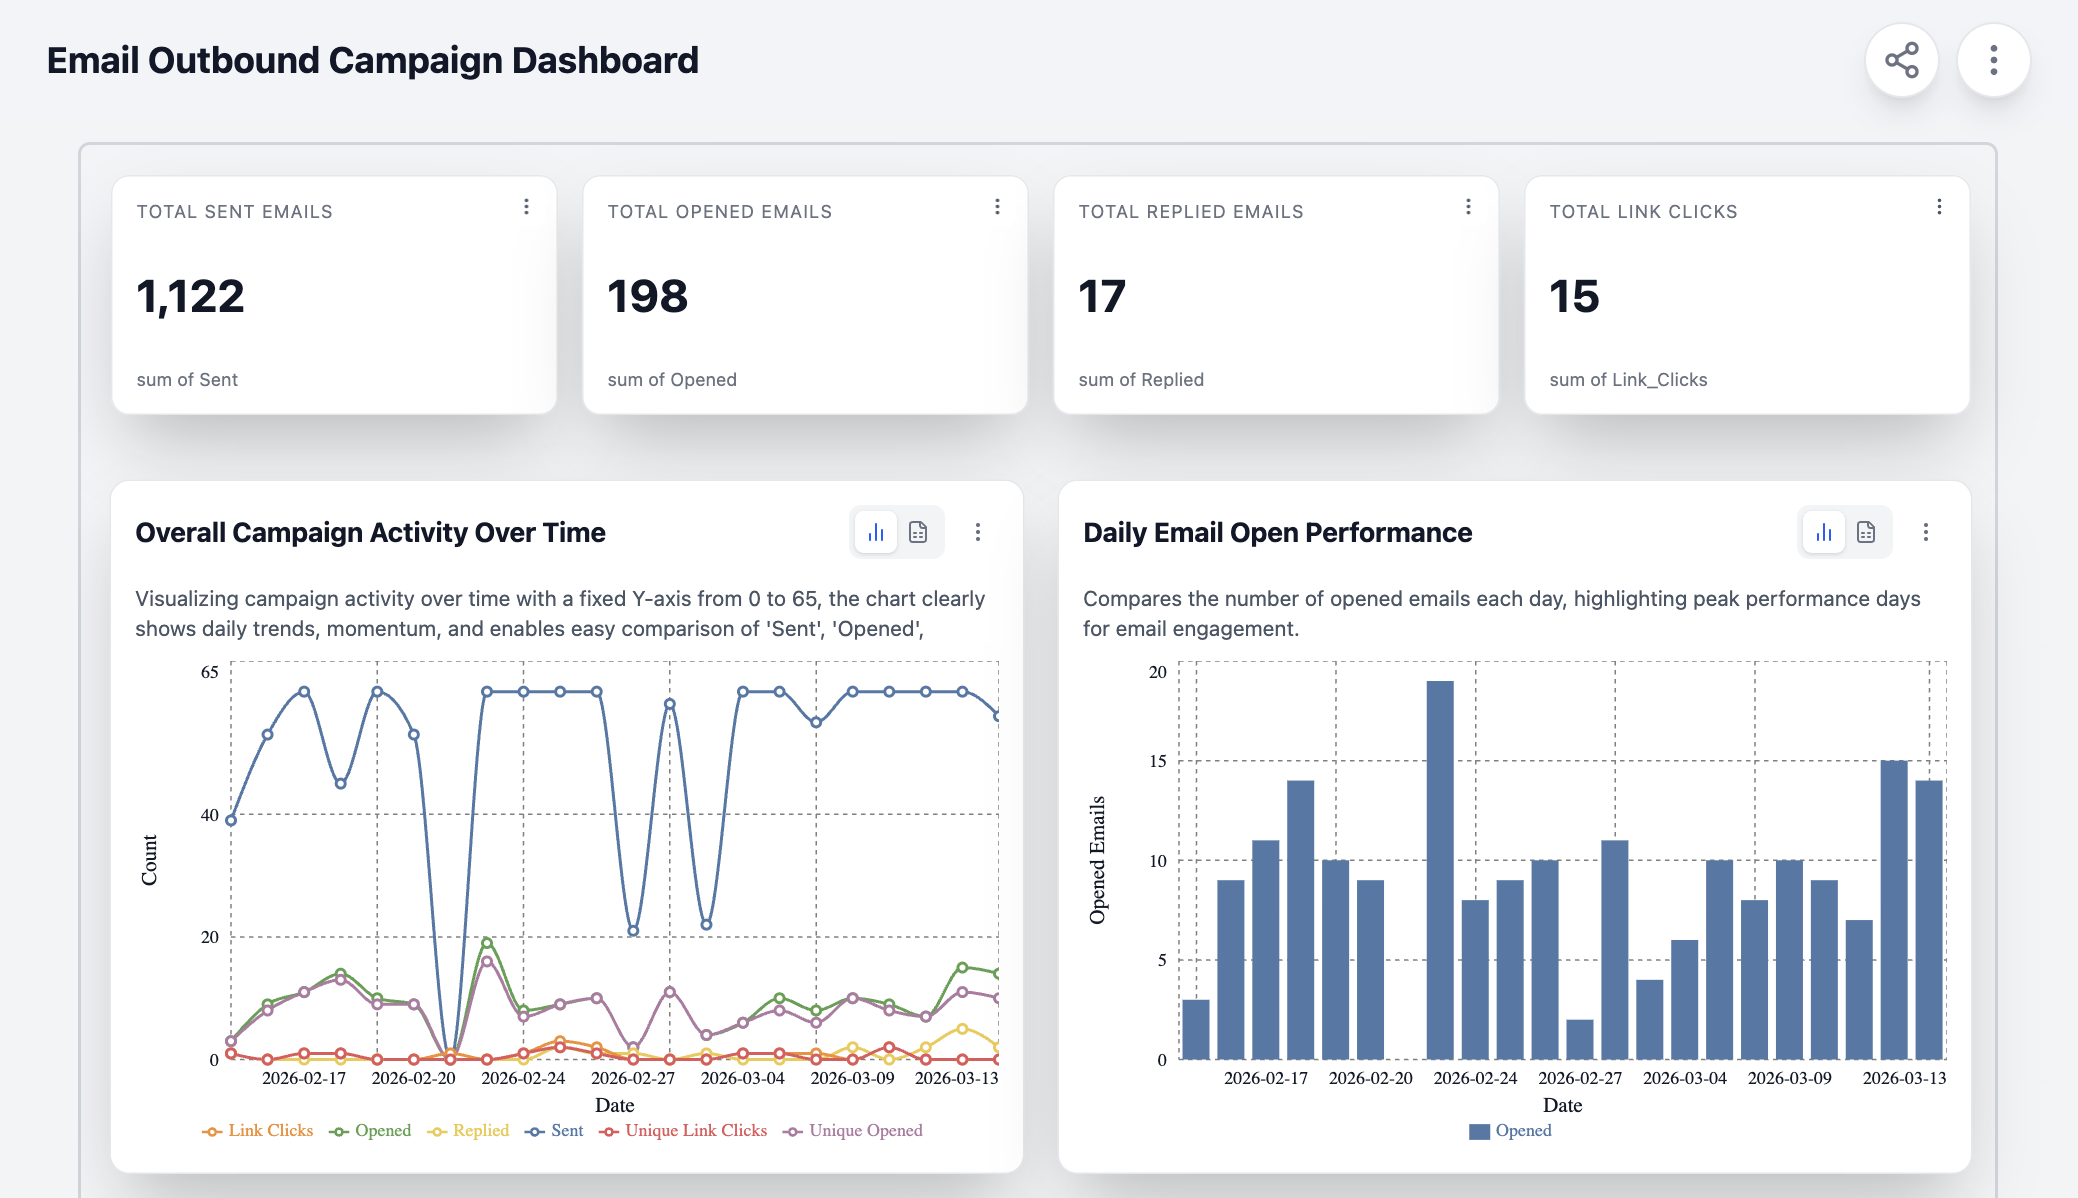
Campaign Performance, Grounded in Governed Metrics
Ask Viz for channel performance and it resolves the question against the metrics your data team defined with Dex, then builds the interactive dashboard around them.
What Your Marketing Team Gets
One agreed definition of spend, conversion, and attributed revenue
Dashboards marketing builds itself, on metrics the data team owns
Reports leadership can explore instead of screenshots in a deck