
Your Semantic Layer, Visualized.
Viz reads the metrics, dimensions, and join paths your team already governs, and turns them into dashboards anyone can build. One governed layer, every dashboard.
14-day free trial on every plan
Revenue
$0k
Users
0
Conv. Rate
0.0%

From governed metrics to dashboards, in minutes
Connect your semantic layer, ask in plain English, and get dashboards that agree with the rest of your stack.
Connect your semantic layer
Point Viz at the dbt Semantic Layer your team already maintains. Metrics, dimensions, and join paths arrive with their real definitions, so there is no duplicate modeling in a BI tool. File uploads still work when you do not have a layer yet.

dbt Semantic Layer
24 metrics, 61 dimensions
net_revenue
Certifiedmonthly · by region
active_customers
Certifieddaily · by plan
users_data.xlsx
89 KBAsk for a metric, not a table
Ask in plain English and Viz resolves the question against your definitions instead of guessing at joins. Every answer names the metric it used and the path it took.
Dashboards that trace back
Interactive dashboards in minutes, and every chart traces from the warehouse to the definition behind it. When the layer changes, the dashboard follows.
net_revenue
$0k
conversion
0.0%
Monthly Revenue
Last 8 monthsWhere Viz sits
Grounded on the layer, not guessing at the warehouse
Point an agent at raw SQL and it invents joins, misses metric definitions, and surfaces data it was never meant to see. Viz reads the governed layer instead: real definitions, verified join paths, and permission-aware context, so the dashboard agrees with the numbers your team already trusts.
 Snowflake
 Databricks
 BigQuery
 Redshift
 ClickHouse
 PostgreSQL
 DuckDBExmergo Dex
Governed
Semantic Layer
Single source of truth
Exmergo AceAgent Context Engine
Exmergo VizBusiness users · Self-serve dashboards
Your custom agent · Build on the same engine
Sources
SnowflakeDatabricksBigQueryRedshiftClickHousePostgreSQLDuckDBExmergo DexGoverned
Semantic Layer
Single source of truth
Exmergo AceAgent Context Engine
Serves
Exmergo VizBusiness users · Self-serve dashboards
Your custom agent · Build on the same engine
Everything you need to turn governed metrics into decisions
From the semantic layer to the dashboard, without redefining a single metric.
Chat with your metrics
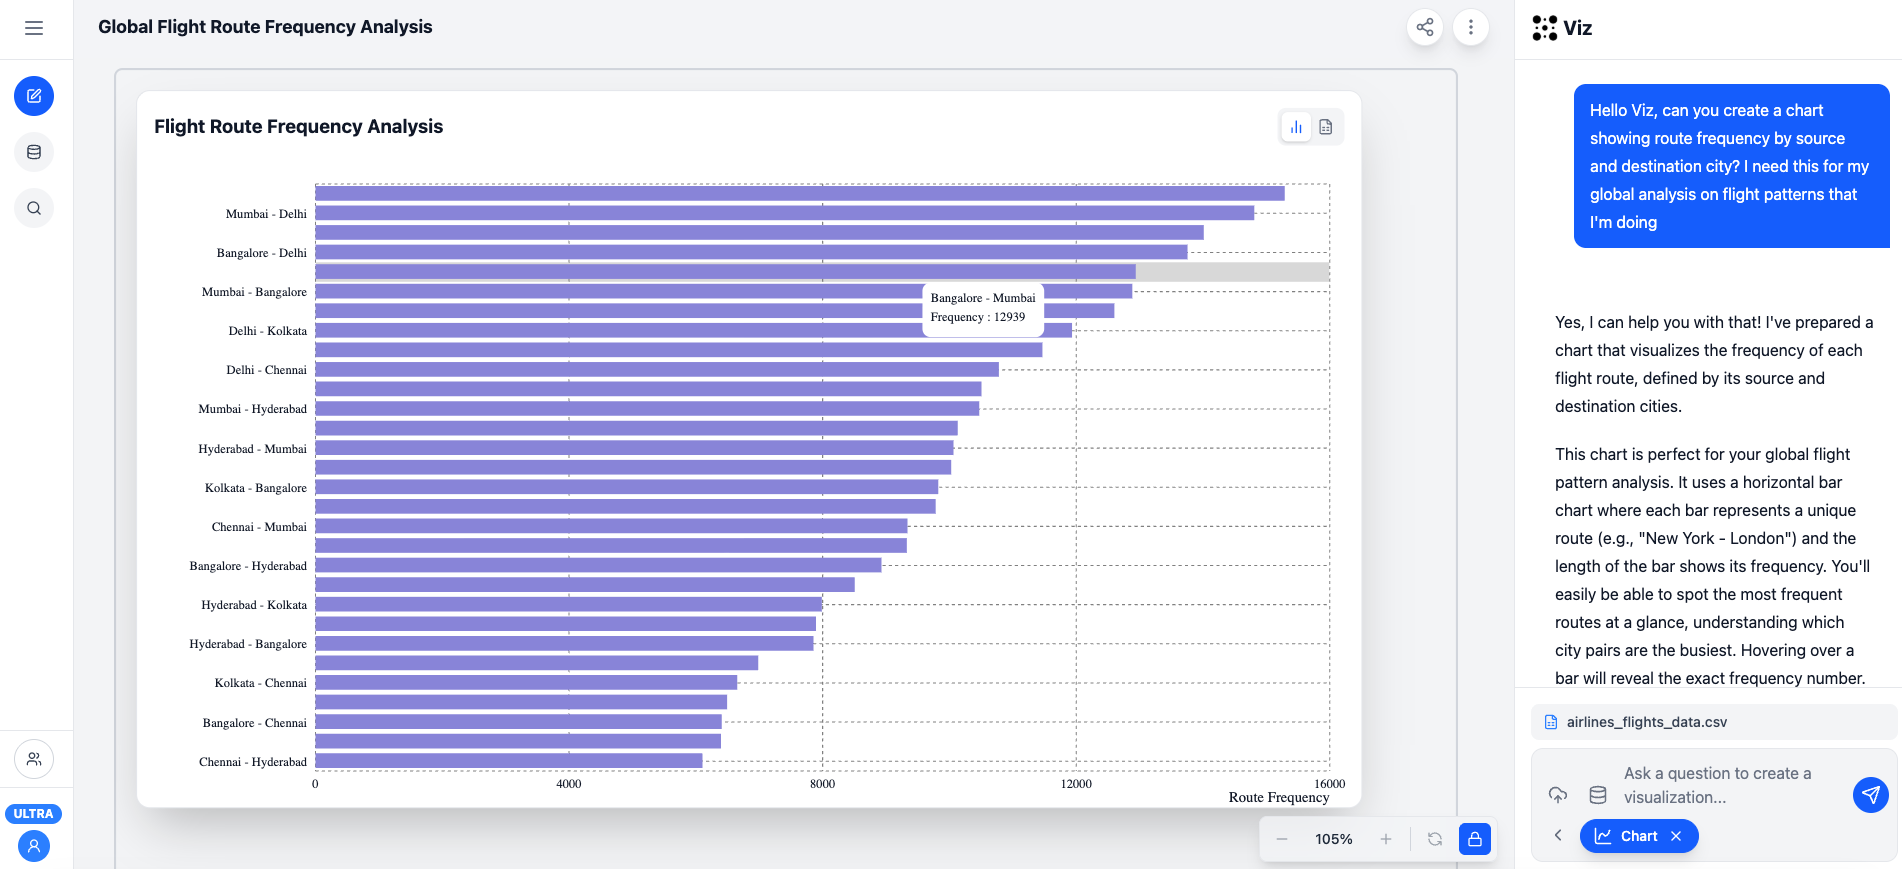
Ask for a metric by name and Viz resolves it against your definitions, follows verified join paths, and charts the result. No SQL, no calculated fields, no re-modeling in a BI tool.
- Metric-aware answers
- Verified join paths
- Dynamic charts
Grounded, and you can prove it
Because every chart resolves against one governed layer, consistency is guaranteed rather than best effort. On Exmergo Enterprise, every answer is auditable by identity, definition, and version.
- Role-based access control (RBAC) and workspace-level permissions
- PII policy enforcement on every query
- Full audit trails, from prompt to chart
- Clear lineage, from governed model to dashboard
Connect your semantic layer, and everything under it
dbt Semantic Layer for governed metrics, plus the databases and platforms your organization already uses.
Ready to put your semantic layer to work?
Viz turns the metrics your team already governs into dashboards the whole company can use.