
For Supply Chain & Operations
From Operational Data to Trusted Supply Chain Metrics
Your data team uses Dex to model the inventory, order, and supplier data already in your warehouse and to maintain the metric definitions behind OTIF and lead time. Operations uses Viz to visualize inventory, OTIF, and supplier performance.
Dex
Explore, transform, maintain
Your data team, in the warehouse and the dbt project
Semantic layer
Models, metrics, join paths
One governed set of definitions your team owns
Viz
Dashboards and reports
Business users, answering their own questions
Your Data Moves Slower Than Your Supply Chain
Operations runs on exports. Purchase orders in one place, receipts in another, supplier quality in a spreadsheet. Even once that data is in the warehouse, the definitions are the real problem: OTIF measured against the original promise date or the revised one, lead time from order date or from confirmation.
Two teams answer the same question differently, the post-mortem argues about the number instead of the miss, and nobody trusts the scorecard enough to act on it.
Exmergo fixes the definitions first. Data teams model the inventory, order, and supplier data already in the warehouse with Dex and maintain the metric definitions in the semantic layer. Operations visualizes them in Viz, where every chart names the definition behind it.
Define the metric, then act on it
Step 1 · Data team
Build the foundation with Dex
Your data team points Dex at the inventory, order, and supplier tables already in the warehouse. Dex profiles them, authors the dbt models that reconcile orders to receipts, and maintains OTIF, lead time, and defect-rate definitions in the semantic layer, flagging drift when a source schema or a grain changes.
Step 2 · Business users
Visualize it with Viz
Operations opens Viz and asks for OTIF by supplier, stock cover by SKU, or lead-time trend. Viz resolves each against the maintained definitions and builds the dashboard the whole ops org reads from.
Operations Visibility Without the Data-Team Wait
Logistics & OTIF Dashboards
Track on-time in-full by supplier, lane, and SKU in Viz, against one OTIF definition maintained in the dbt project rather than re-argued per report.
Inventory & Demand Visibility
Visualize stock levels, turnover, and cover across SKUs and locations, built on models Dex authored from the data already in your warehouse.
Supplier Performance & Risk
Score suppliers on on-time delivery, defect rate, and cost variance, with each measure defined once in the semantic layer and charted in a single interactive dashboard.
One Operations View, One Set of Definitions
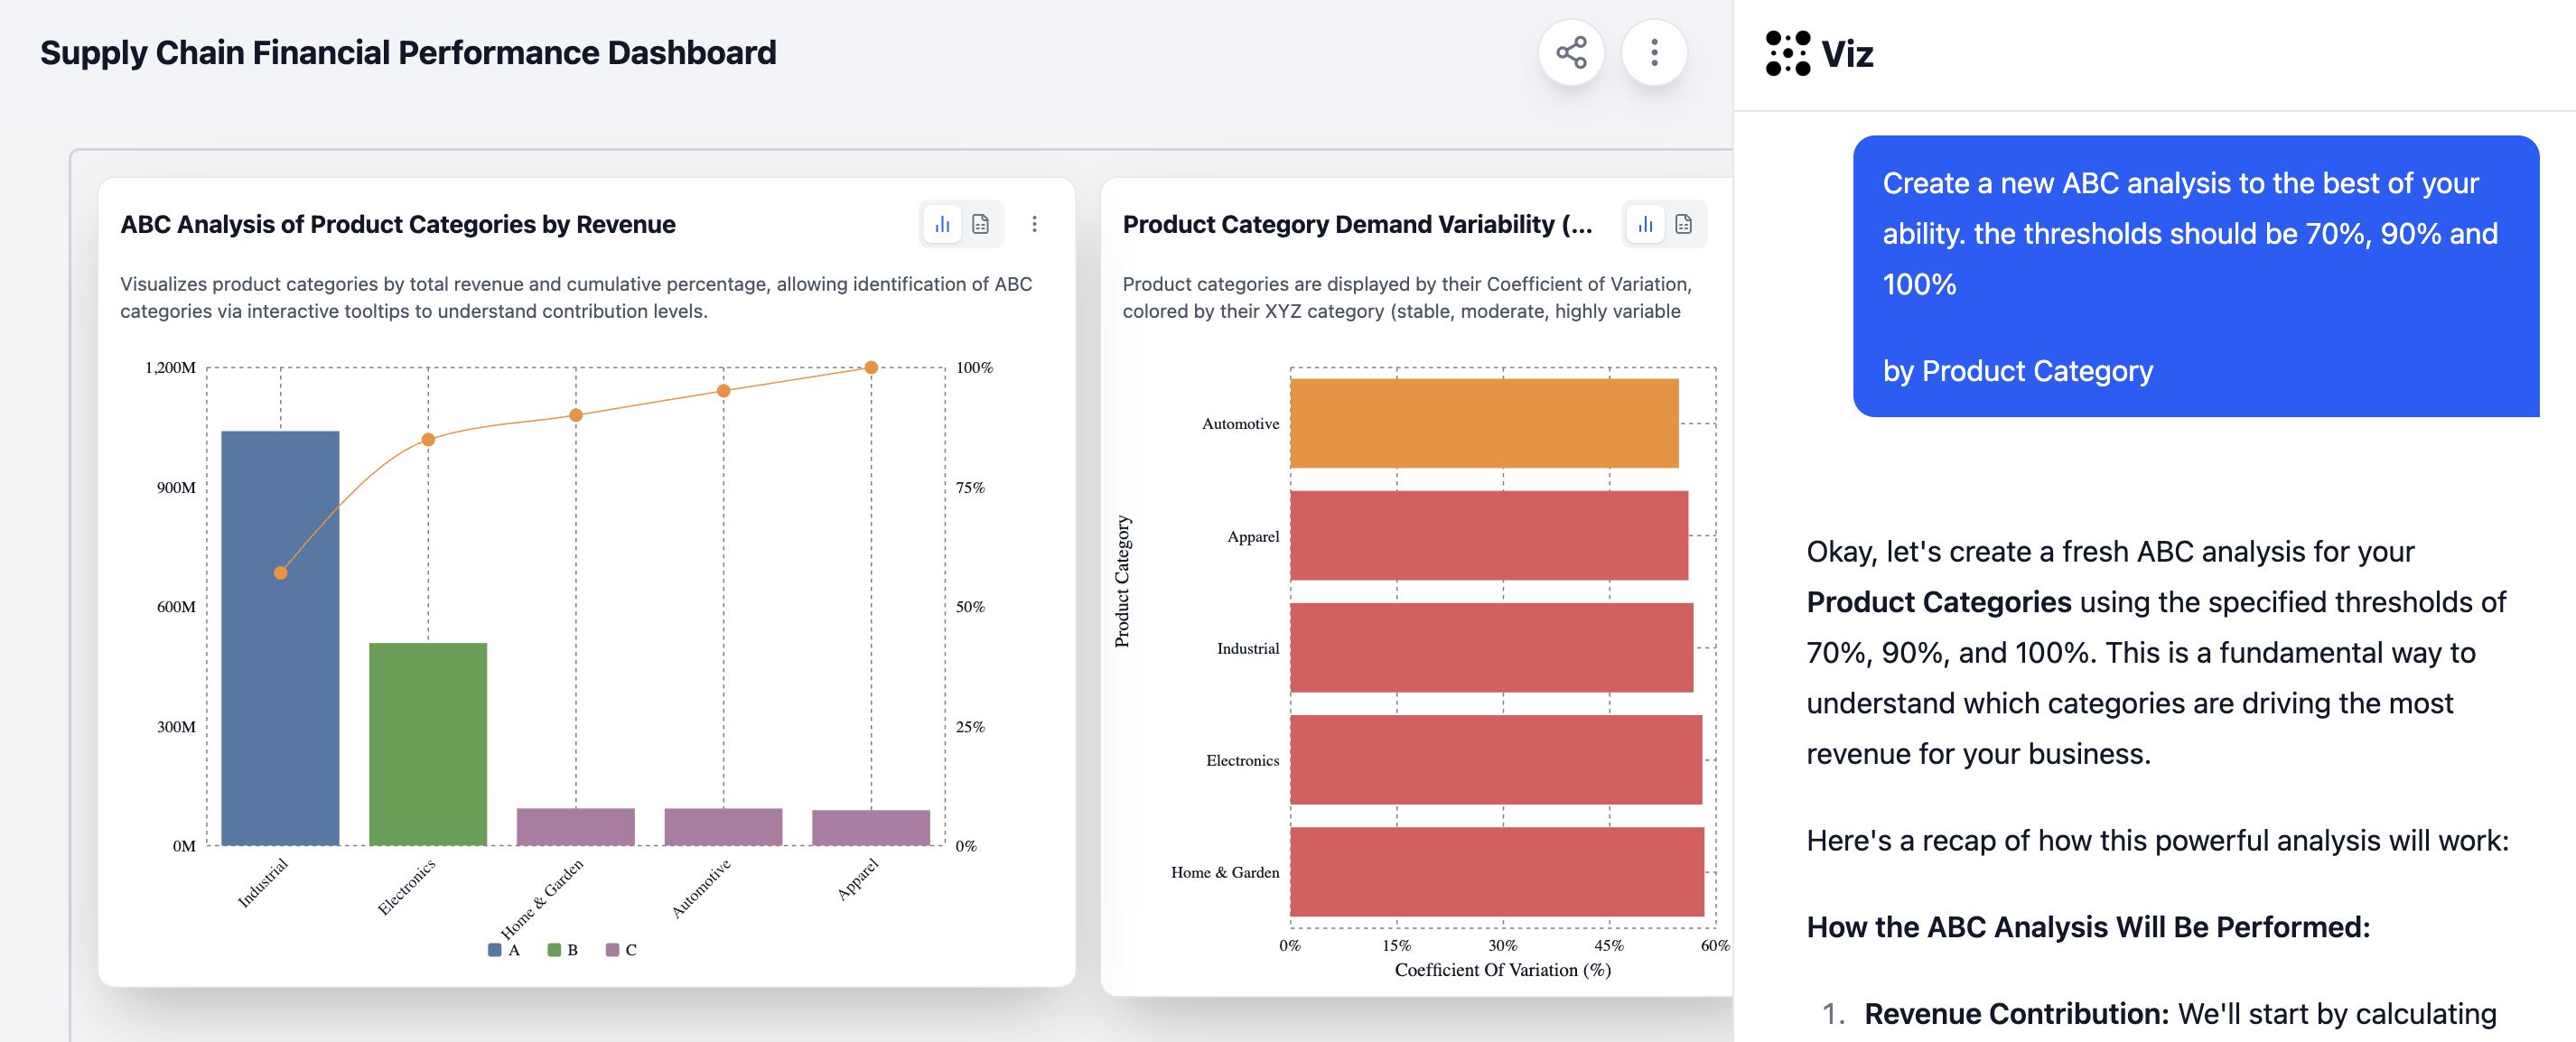
Ask Viz for OTIF, lead-time drift, or supplier risk and it resolves the question against the metric definitions your data team maintains with Dex.
What Your Operations Team Gets
One definition of OTIF, lead time, and defect rate across the org
Schema and grain drift flagged before it distorts a scorecard
A single operations view ops and procurement both read from