
Viz: Your Semantic Layer, Visualized
Viz is now the visualization agent for your semantic layer. Its first semantic connector is the dbt Semantic Layer, and it is live today.

Co-Founder & CEO
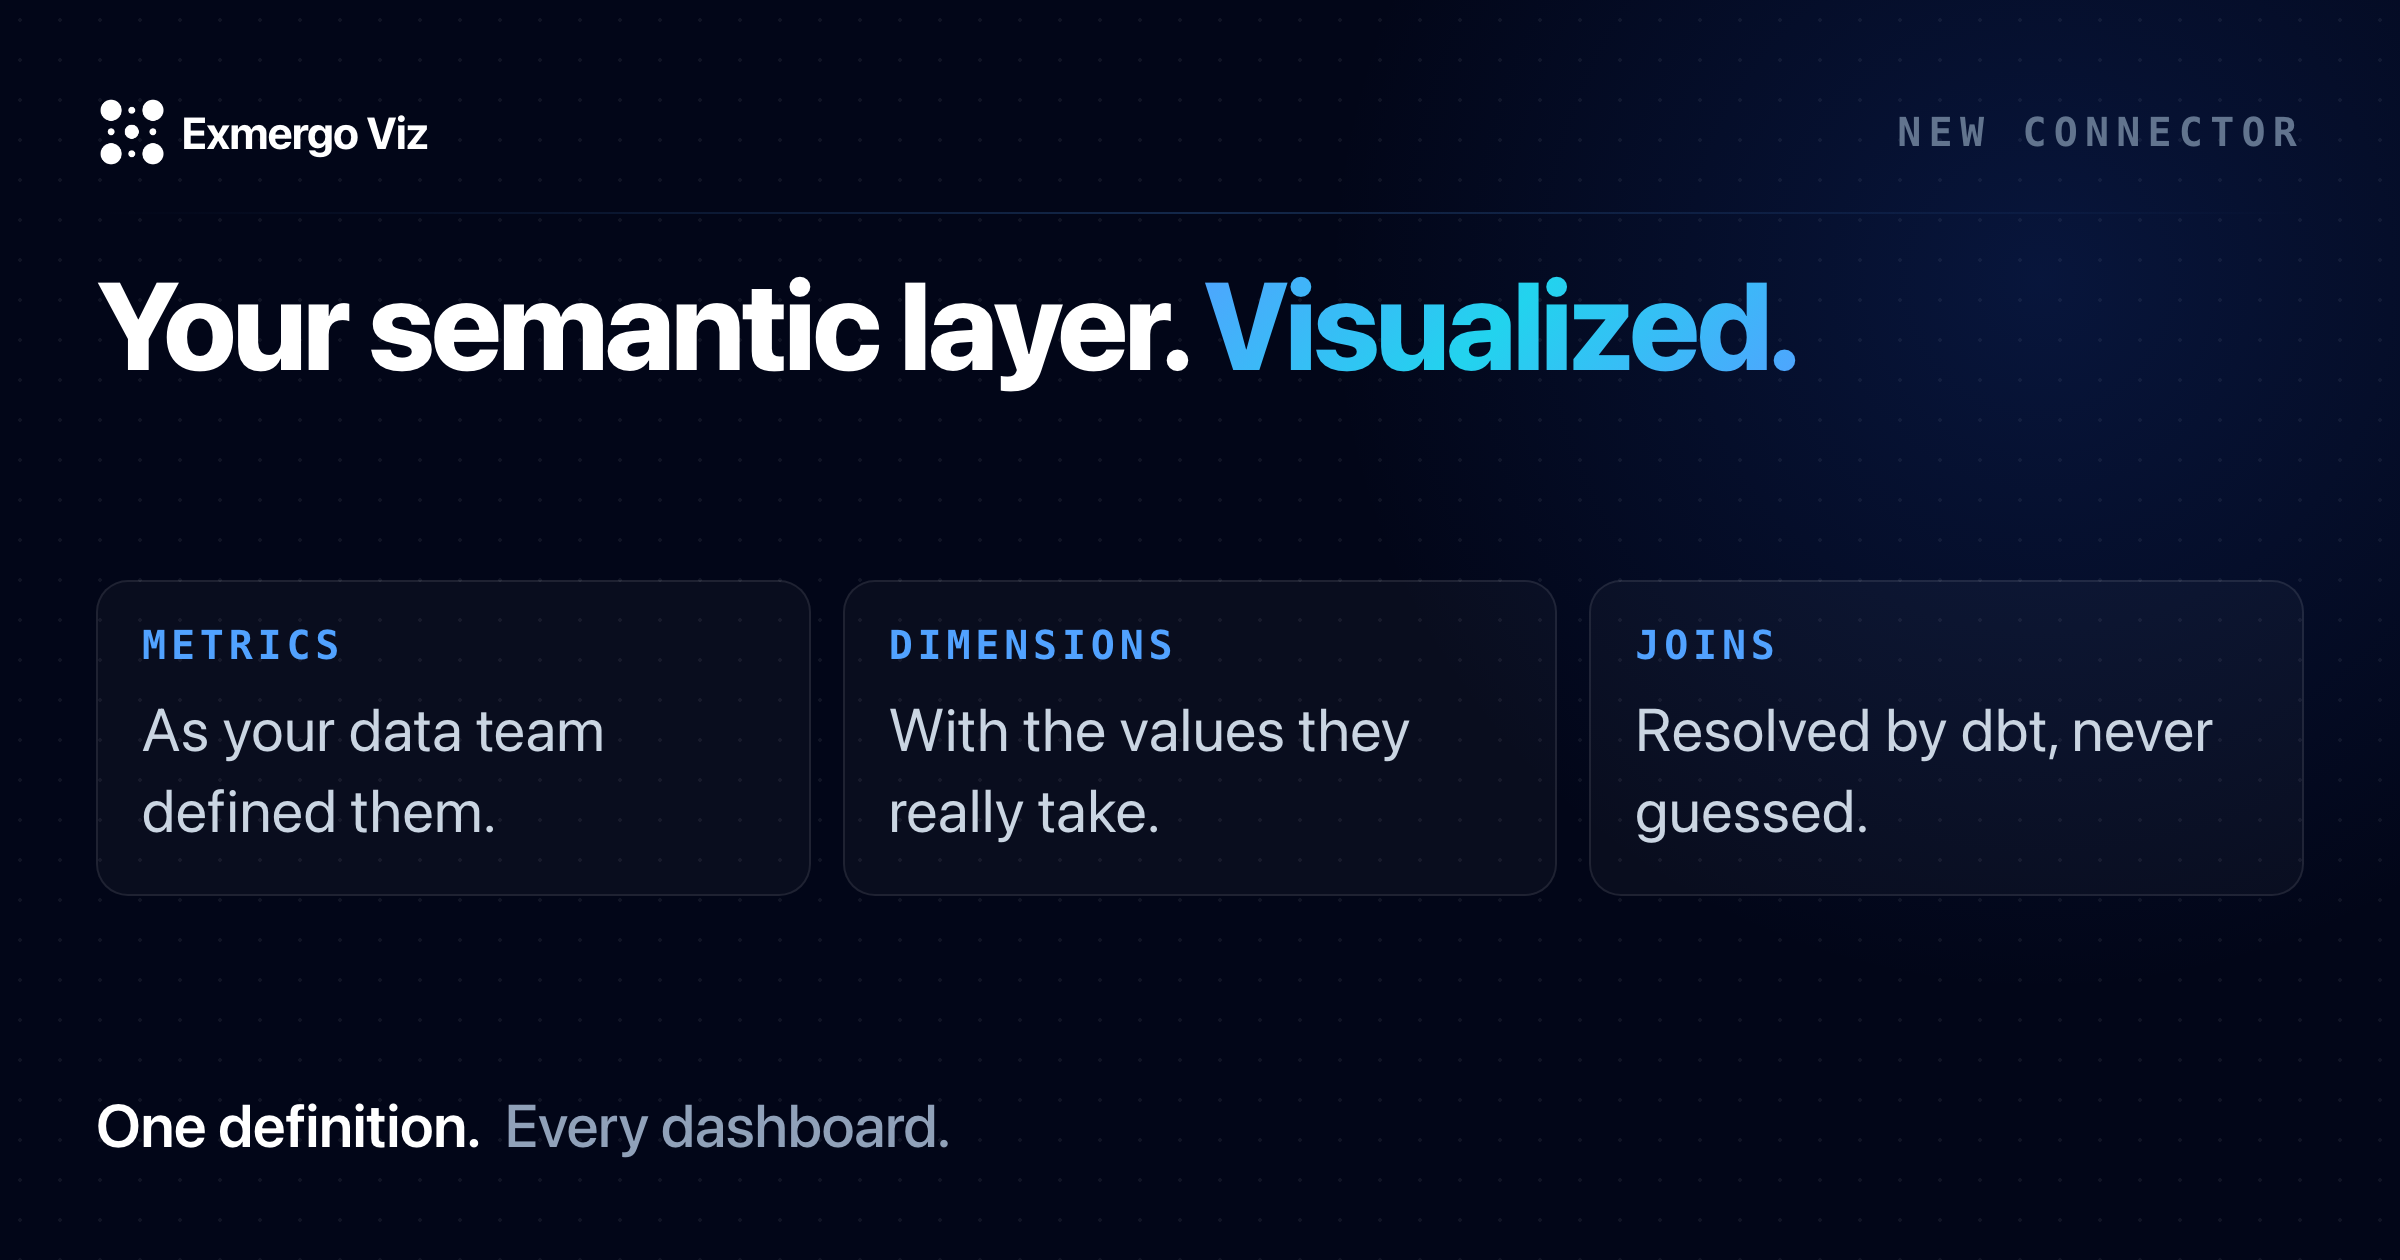
Viz is now the visualization agent for your semantic layer. Its first semantic connector is the dbt Semantic Layer, and it is live today.
The layer is the interface.
Ask an agent a business question against a raw warehouse and it has to make a series of small decisions nobody asked it to make. Which of the four tables with "revenue" in the name is the real one. Whether refunds come out before or after tax. Whether an "active customer" was active in the last thirty days or the last ninety. Which join between orders and accounts does not quietly double every row.
It will make all of those decisions, confidently, in under a second. Some of them will be wrong, and the chart will look exactly as convincing either way.
The frustrating part is that your data team already made those decisions. They made them carefully, argued about them in review, and wrote them down in the semantic layer: metrics with a definition, dimensions with a meaning, entities that say how things are allowed to join. The semantic layer is where a definition has an owner.
That makes it the natural translation layer between agents and data. Not the warehouse, which knows columns but not meaning. Not a BI tool's private model, which is a copy that drifts from the original the week after it is built. The layer your data team maintains is the one place where "revenue" means one thing.
So that is where we are building Exmergo. Dex helps data teams author and maintain the layer. Viz lets everyone else self-serve on it. The data team stays the source of truth; the rest of the company stops waiting on them for every chart.
What Viz is now.
Viz used to be a dashboard agent that worked on whatever data you gave it. It was good at turning a spreadsheet into a chart. It was also, necessarily, guessing about what the data meant.
Viz now starts from the definitions instead. You ask for a metric by name, in plain English, and Viz resolves the question against your layer: the metric your team defined, the dimensions it can be sliced by, the joins dbt already knows are safe. Every chart names the metric it used. When the definition changes in dbt, the dashboards follow, because there is no second copy of the definition to update.
How the dbt connector works.
Connect. You give Viz three things: your dbt Cloud Semantic Layer host, an environment ID, and a service token scoped to "Semantic Layer Only". That is the whole setup. Viz reads the layer's manifest: metrics, dimensions, entities and semantic models, plus the values of low-cardinality dimensions so filters offer real options. A semantic layer browser shows what came across, including a map of how the models relate.
Ask. Someone asks, "What was net revenue by region last quarter?" Viz grounds the request against the manifest, then writes a metric query: which metrics, grouped by which dimensions, filtered how, ordered how, limited to how many rows.
Query. Viz sends that metric query to dbt Cloud. dbt compiles the SQL, including the joins, and runs it on your warehouse. Viz receives the aggregated result and charts it. The layer is queried live; it is never ingested into tables of Viz's own.
Trace. The chart says which metric it came from. On Exmergo Enterprise, that trace is backed by role-based access control, PII policy enforcement and full audit trails.
One detail we are quietly pleased about: Viz talks to the dbt Semantic Layer through Dex's own engine. The GraphQL client, the identifier validation and the result handling are the same code analytics engineers already run in Dex. We did not write a second one.
What came out better than we expected.
There is no escape hatch. Viz holds no warehouse credentials. When a question gets hard, the agent cannot fall back to raw SQL, sample a table, or improvise a join. It can read the manifest, read a dimension's values, and run real metric queries, and it gets at most three exploratory queries per turn to check its assumptions. That makes it deliberately weaker than an agent with SQL access. It is also exactly why every number it shows can be traced to a definition someone owns. When the layer cannot answer a question, Viz says so.
Drift is loud. Semantic layers change. A metric gets renamed, a dimension gets retired. When Viz refreshes the manifest and a saved chart depends on something that no longer exists, the chart shows as broken and offers a remap. It does not quietly draw something else, and it does not serve a stale result when a query fails. An empty chart that looks like "zero" is the worst failure a dashboard can have, so a failure in Viz always looks like a failure.
Your dbt Cloud quota is respected. Semantic layer queries count against your dbt Cloud plan. Identical queries are served from a 15-minute cache, so reloading a dashboard does not spend anything, and a per-connection guard stops Viz from burning through your allowance on your behalf. If you hit it, Viz tells you in the chat instead of failing silently.
Limits, stated plainly.
One source per chart. In this version a chart comes from one source. A metric from your layer cannot yet be joined to an uploaded spreadsheet.
dbt Cloud only. The connector uses the hosted dbt Cloud Semantic Layer. Local dbt Core and self-hosted MetricFlow are not supported yet.
Bounded queries. Each query has a 30-second budget and a row limit, and large breakdowns lean toward the top values. That is a choice for interactive dashboards, not a data export.
Where Dex fits.
Viz reads a semantic layer. It does not build one.
If you do not have a layer yet, that is the first job, and it is the job Dex is for. Dex is our open-source toolkit for analytics engineers. It runs inside your coding agent, explores the warehouse, and authors and maintains the dbt models and MetricFlow definitions that Viz then reads. Dex keeps the layer true; Viz puts it in front of everyone else.
Until then, Viz still takes CSV and Excel uploads on every plan.
Pricing.
Semantic layer connections are included from Pro. Pro ($19/month) includes one semantic layer per account; Ultra ($99/month) includes unlimited. Exmergo Enterprise adds unlimited users, RBAC, PII policy enforcement and audit trails. Every Viz plan starts with a 14-day free trial.
Try it.
If your team already maintains a dbt Semantic Layer, you are minutes from a dashboard that agrees with it. Connect it at viz.exmergo.com, and see what the connector reads at exmergo.com/connectors/dbt.
dbt is the first semantic layer Viz reads. Tell us which one should be next.
Define it once. Every dashboard agrees.