
Your Semantic Layer, Visualized.
Exmergo Viz turns the metrics your team already governs into clear, interactive dashboards, powered by AI and designed for everyone who needs an answer from them.
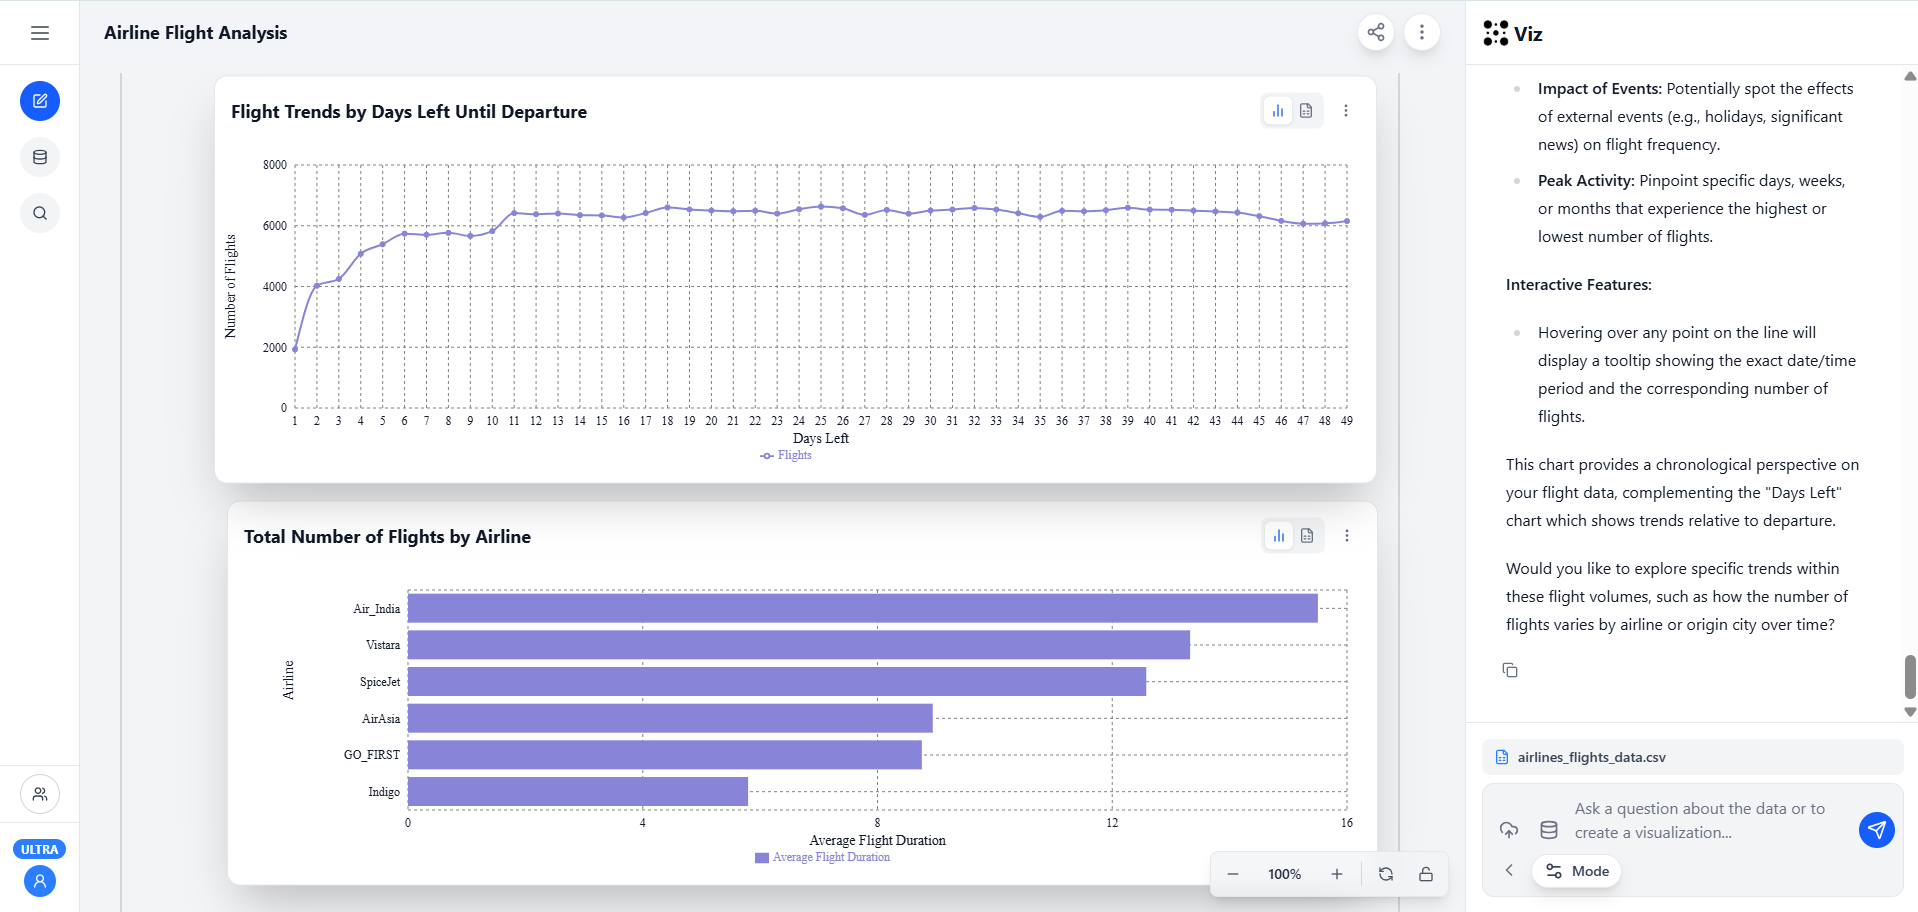
Interactive dashboards and visual analytics
Viz transforms your data into interactive dashboards with multiple visualizations. Users can explore patterns, compare metrics, and understand results through clear charts and contextual explanations.
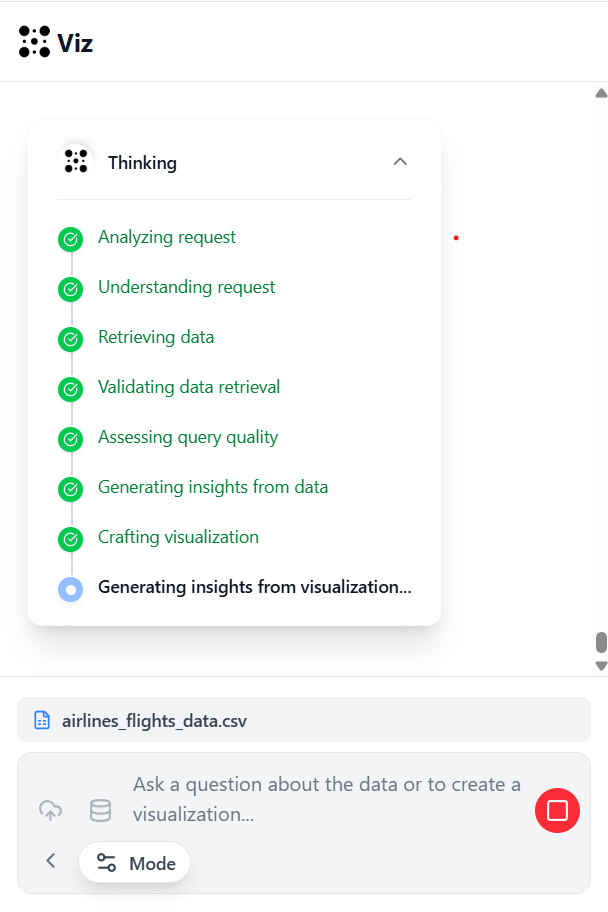
Transparent, step-by-step analysis
Viz shows how insights are produced, from understanding the question to validating data and generating visualizations. This transparency builds trust and helps users understand each step of the analysis process.
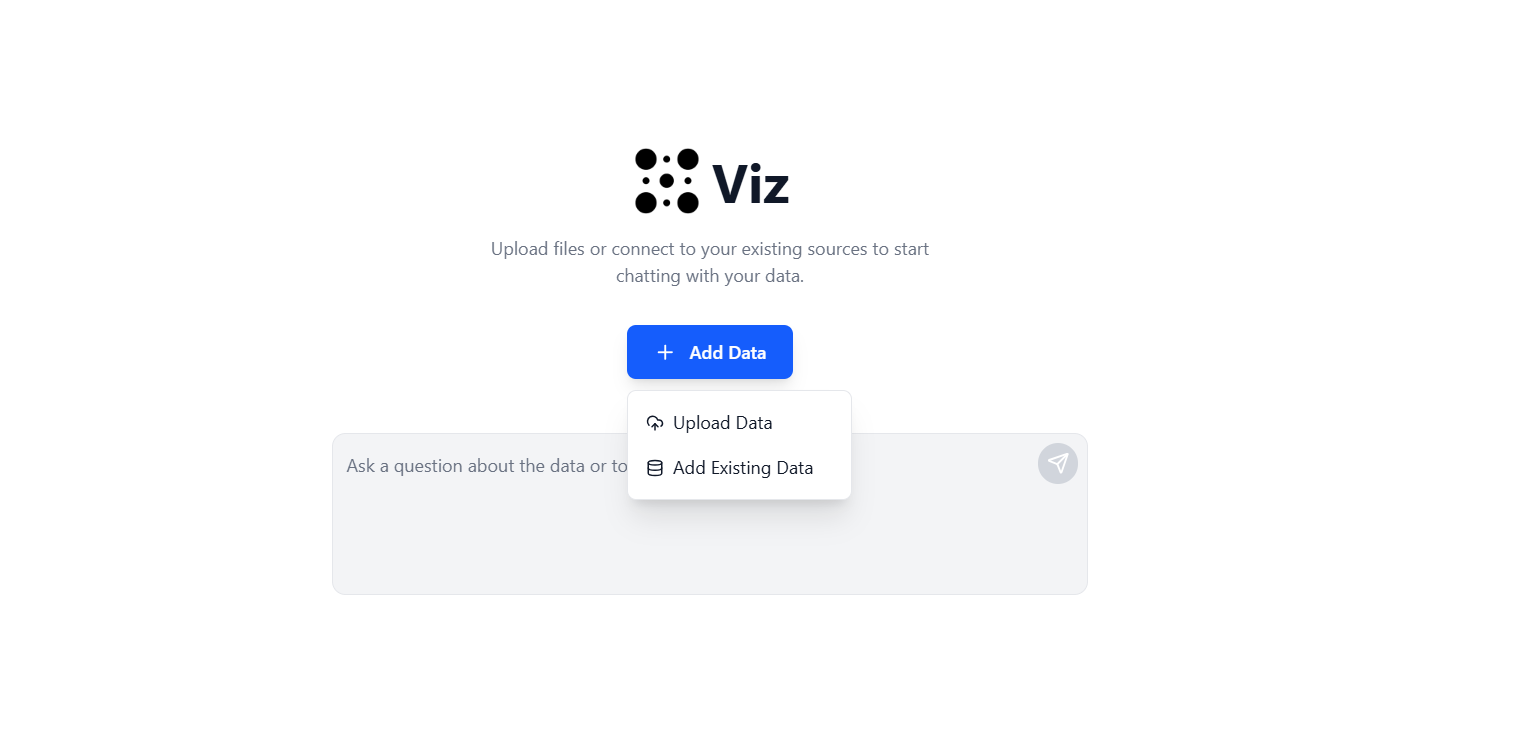
Connect your semantic layer or your data
Point Viz at your dbt Semantic Layer to chart governed metrics, or upload files when you do not have a layer yet.
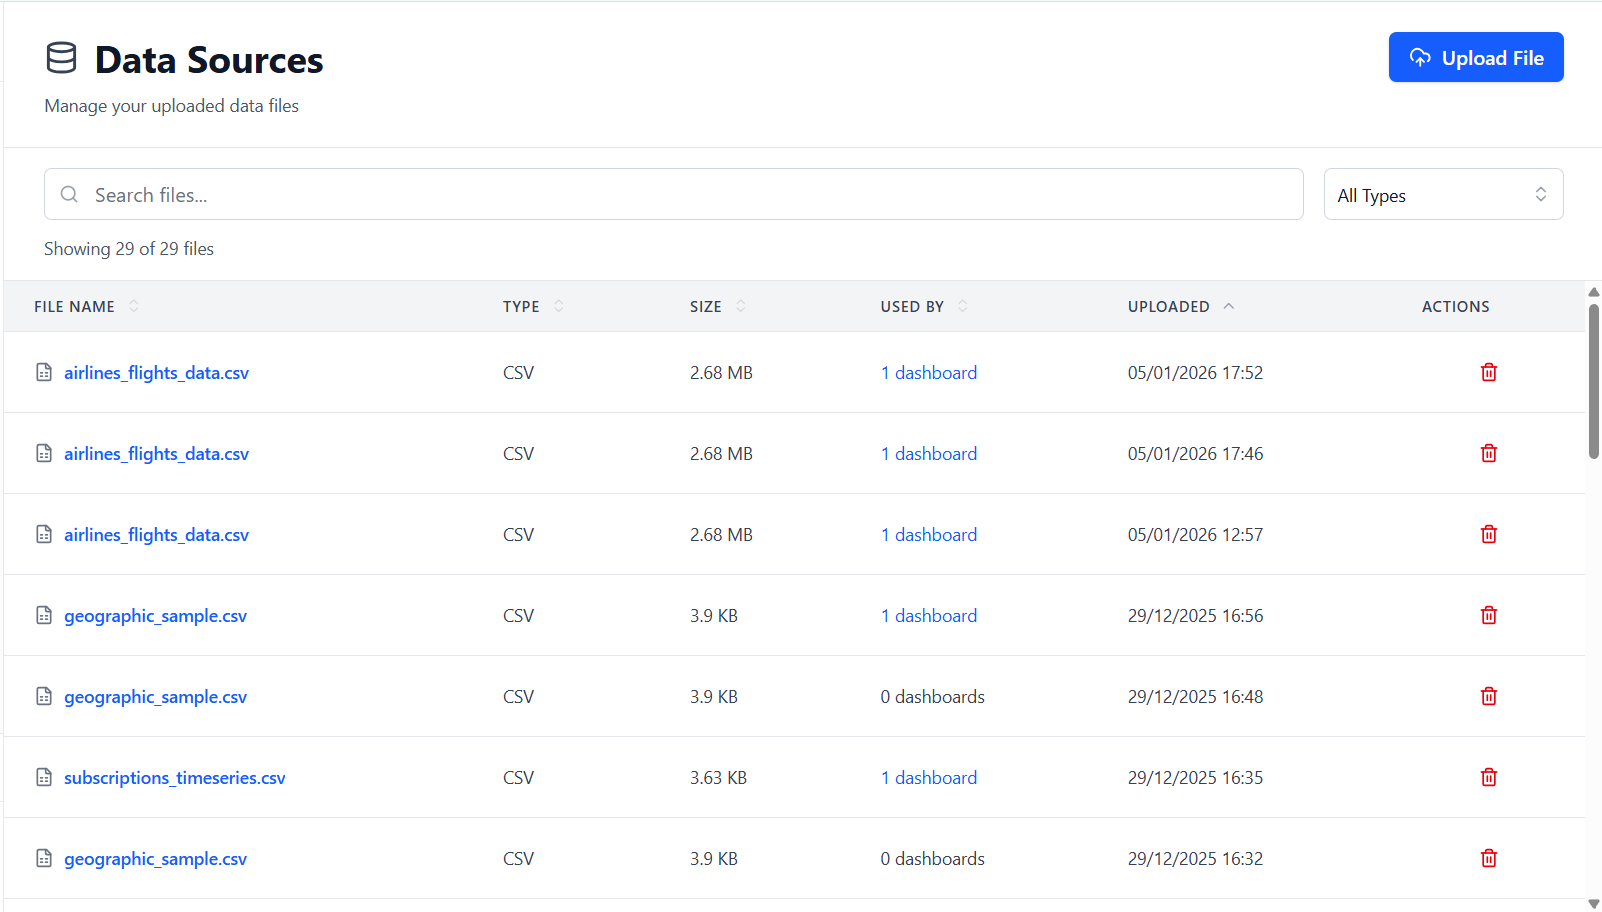
Manage your data sources
Search, filter, track usage, and delete data sources from a single interface.
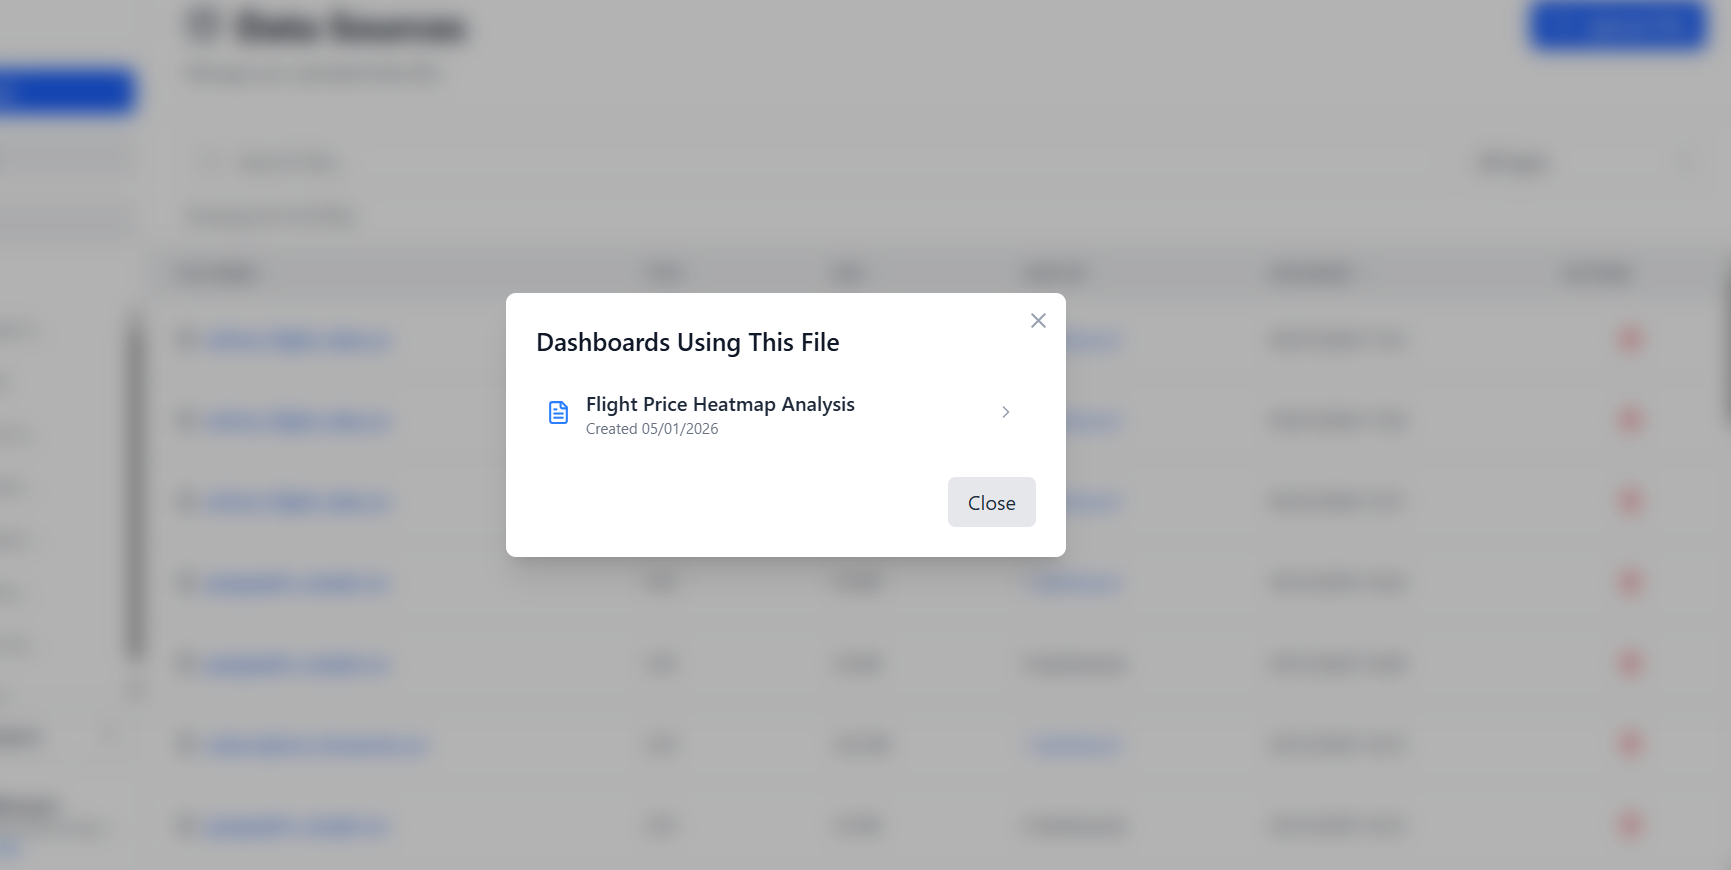
Understand data usage across dashboards
See exactly which dashboards depend on each file and navigate to them instantly.
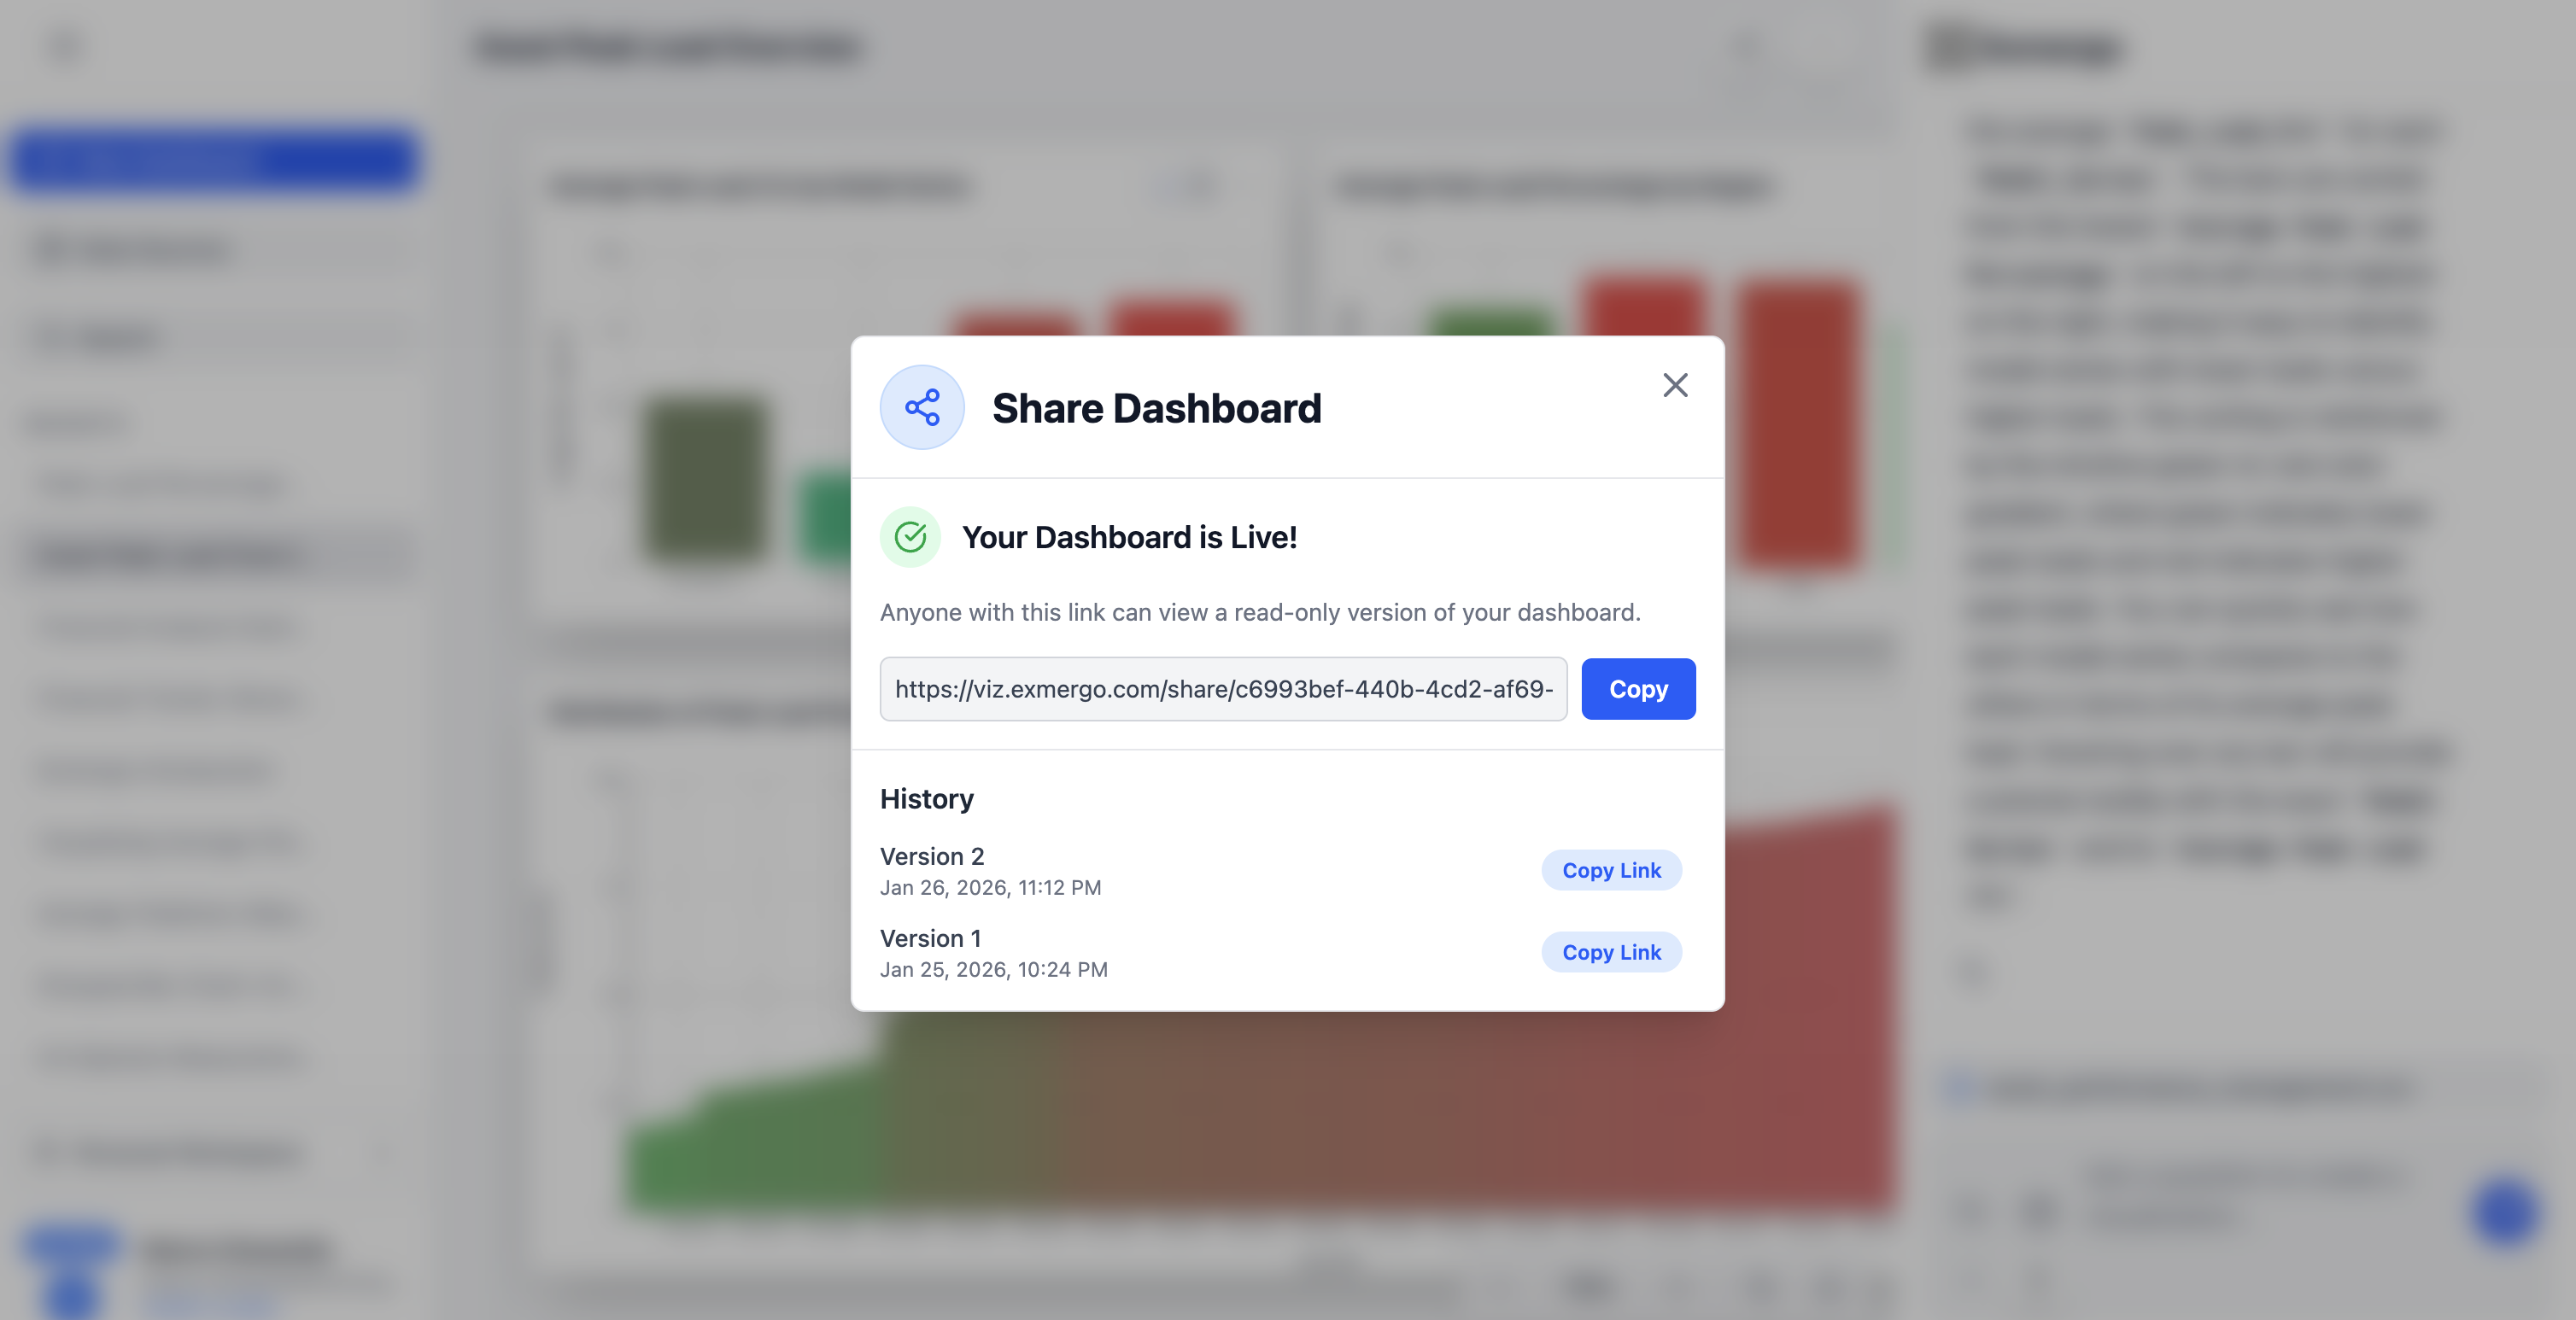
Publish and share your dashboards
Publish your dashboards to share them with colleagues and stakeholders.
Ready to turn your data into decisions?
Exmergo Viz helps teams explore data, uncover insights, and monitor performance with confidence.